How to Set up Xdebug in PhpStorm | PhpStorm Documentation
Xdebug is a PHP extension that offers many debugging and profiling features to support developers in troubleshooting and optimizing their PHP code. These features include code coverage, stack traces, profiling information, and many other capabilities.
In this article, we will walk you through how to set up Xdebug in PhpStorm to enhance your development process. Let’s dive in!
Step 1: Install the Xdebug module into PHP
Firstly, you need to ensure that PHP is installed on the system. If not, you can install it based on your operating system. For example, on Ubuntu, you can use:
sudo apt update
sudo apt install php8.3
Then, install the Xdebug extension compatible with your PHP version. You can use the following command:
sudo apt-get install php{php_version}-xdebug
Ex: sudo apt-get install php8.3-xdebug
To check your Xdebug run this command php -v

You will see the Xdebug with that version.
Step 2: Configure Xdebug in xdebug.ini
Open xdebug.ini file to edit
You can use either of the following commands:
sudo gedit /etc/php/8.3/mods-available/xdebug.ini
or
sudo nano /etc/php/8.3/mods-available/xdebug.ini
Copy and paste this content to this file
Add the following Configuration for Xdebug 3:
[Xdebug]
zend_extension="xdebug.so"
xdebug.mode=debug,develop
xdebug.start_with_request=default
xdebug.idekey=PHPSTORM
xdebug.client_port=9000 #run on port 9000
xdebug.file_link_format=phpstorm://open?%f:%l
For Xdebug 2, use the following configuration:
#zend_extension=/usr/lib/php/20151012/xdebug.so
xdebug.remote_autostart = 1
xdebug.remote_enable = 1
xdebug.remote_handler = dbgp
xdebug.remote_host = 127.0.0.1
xdebug.remote_log = /tmp/xdebug_remote.log
xdebug.remote_mode = req
xdebug.remote_port = 9000  #run on port 9000
-
Save and close the file
-
Restart apache:
sudo service apache2 restart
Step 3: Configure PhpStorm
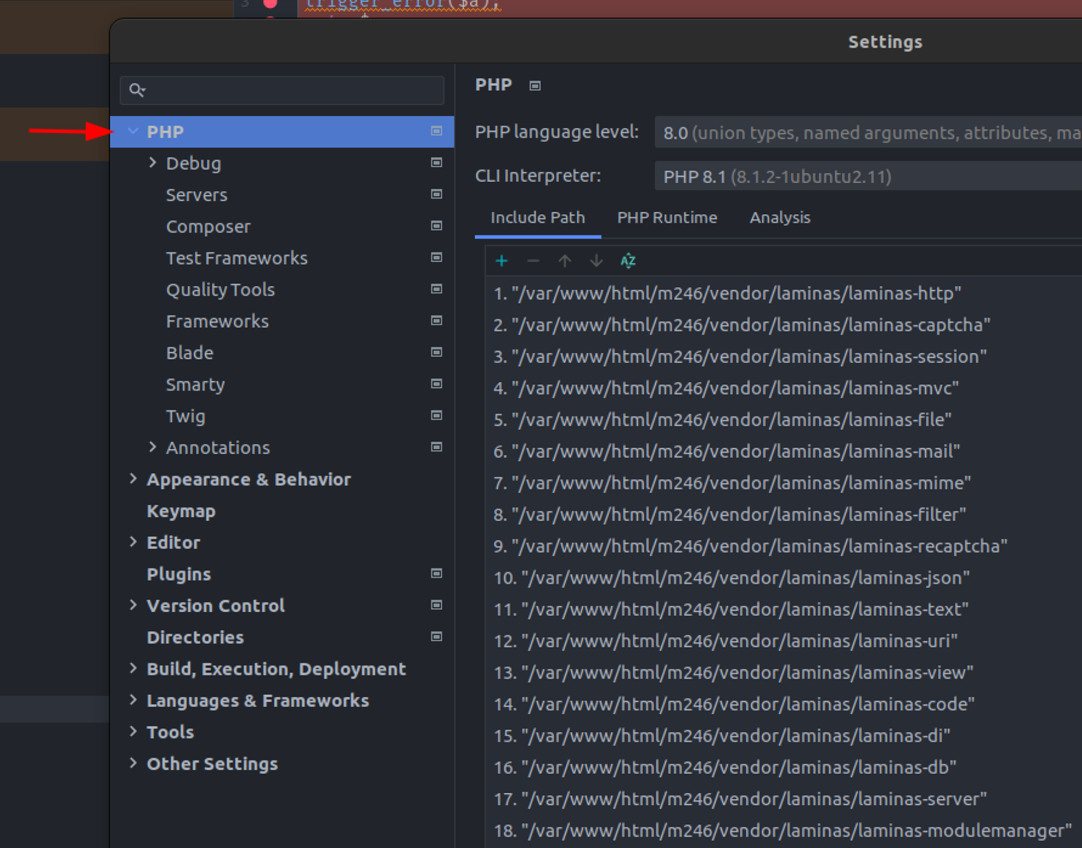
-
Open
PhpStorm > Navigate to settings > select PHP -
Go to Debug in the top left corner > set the
Debug portto 9000 as specified in thexdebug.ini
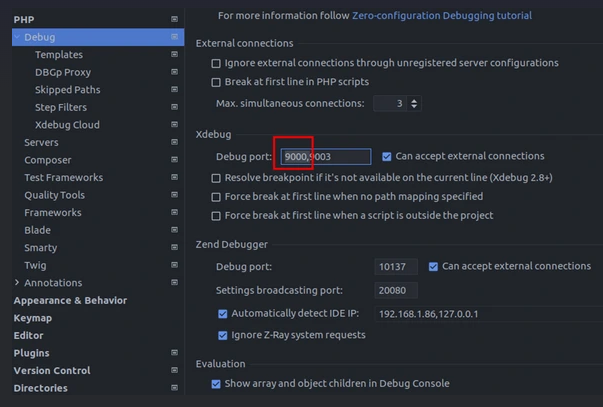 Turn on listening at the configured port by clicking on the call icon

Step 4: Install the Xdebug Chrome extension
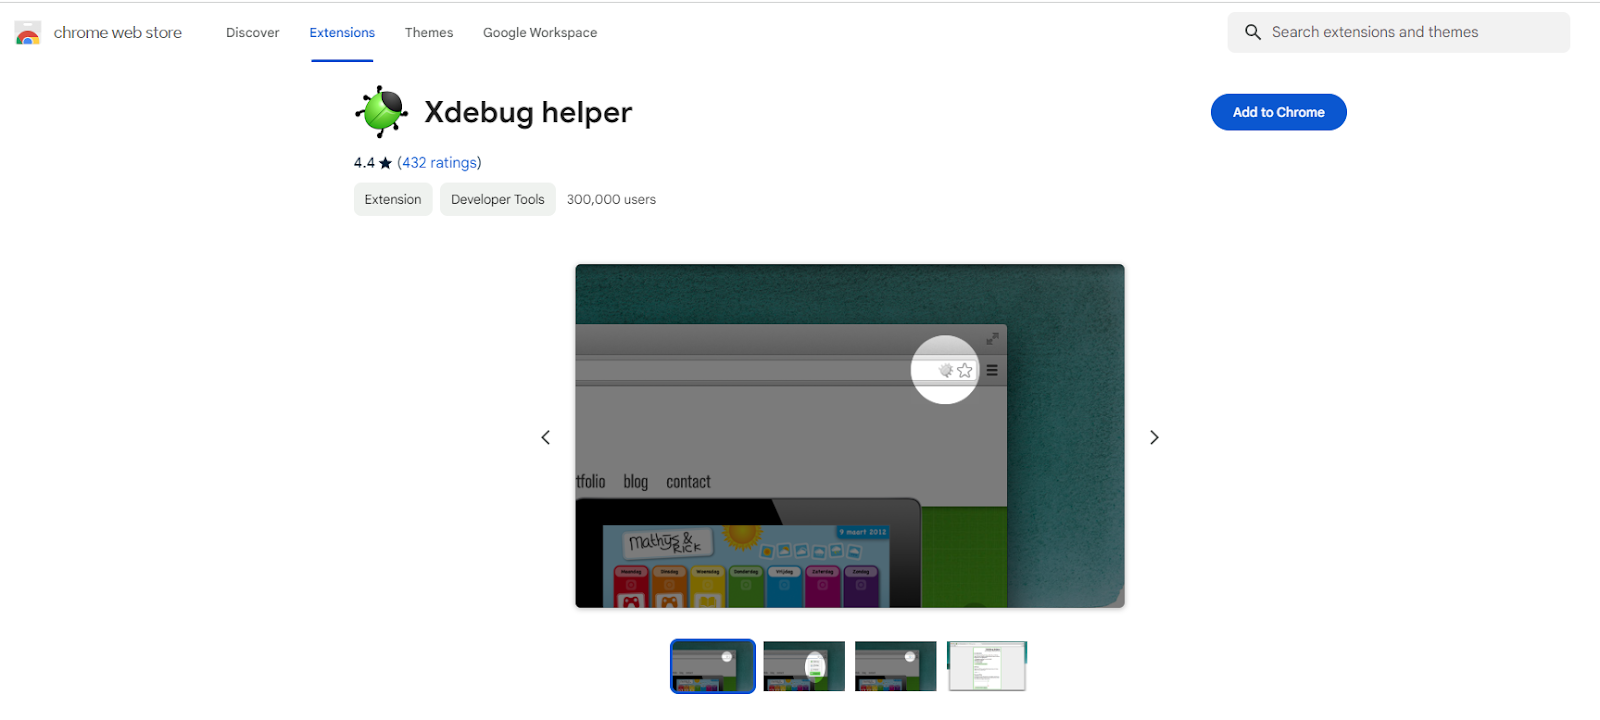
To enable Xdebug for the browser, you need to install the Xdebug Chrome extension, follow these steps to install the extension.
- Download the Xdebug Chrome extension by going to Chrome web store and then click add to Chrome to install the extension
- In the browser, Go to
Option > set the IDE KEY to PHPSTORM

- Then, on the Magento Site, start the session of Xdebug by enabling the Chrome extension

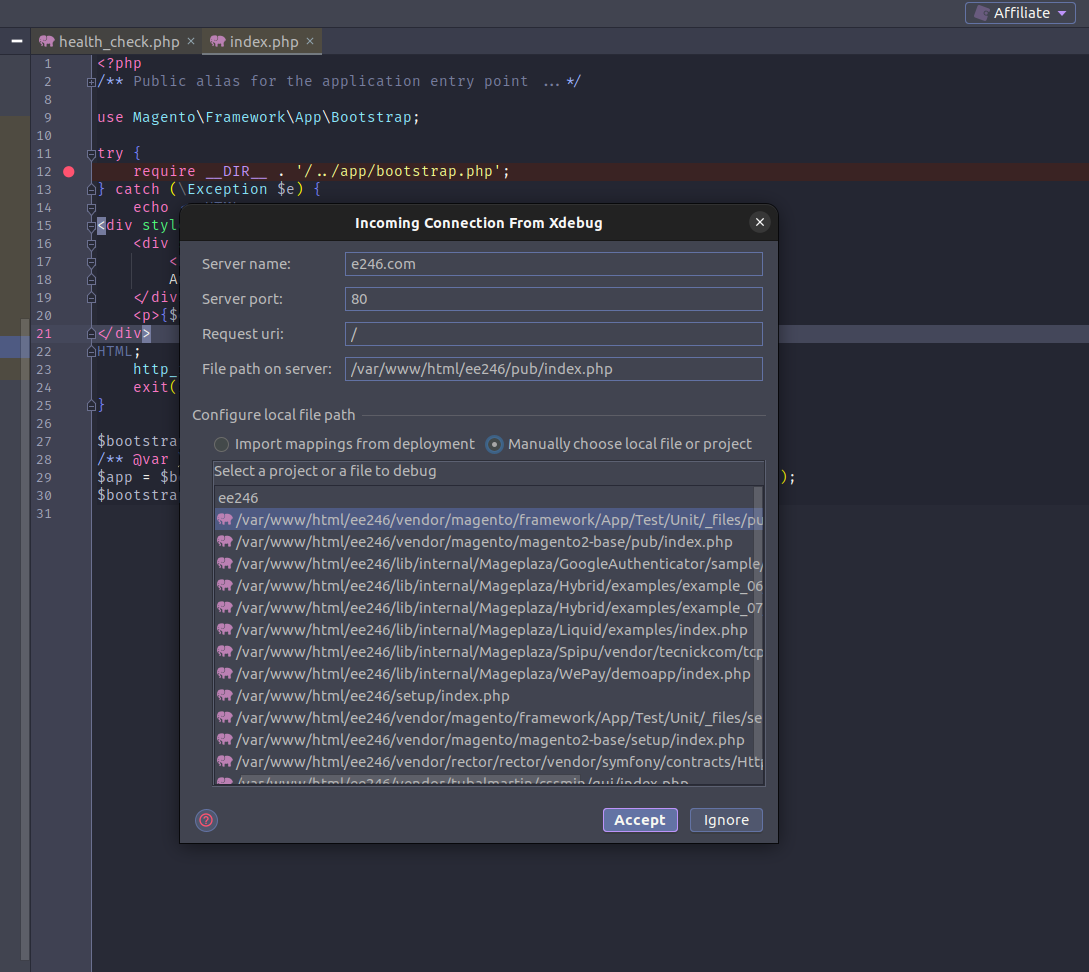
- After that, refresh your Magento site and check your PHPStorm
-
Click
accept -
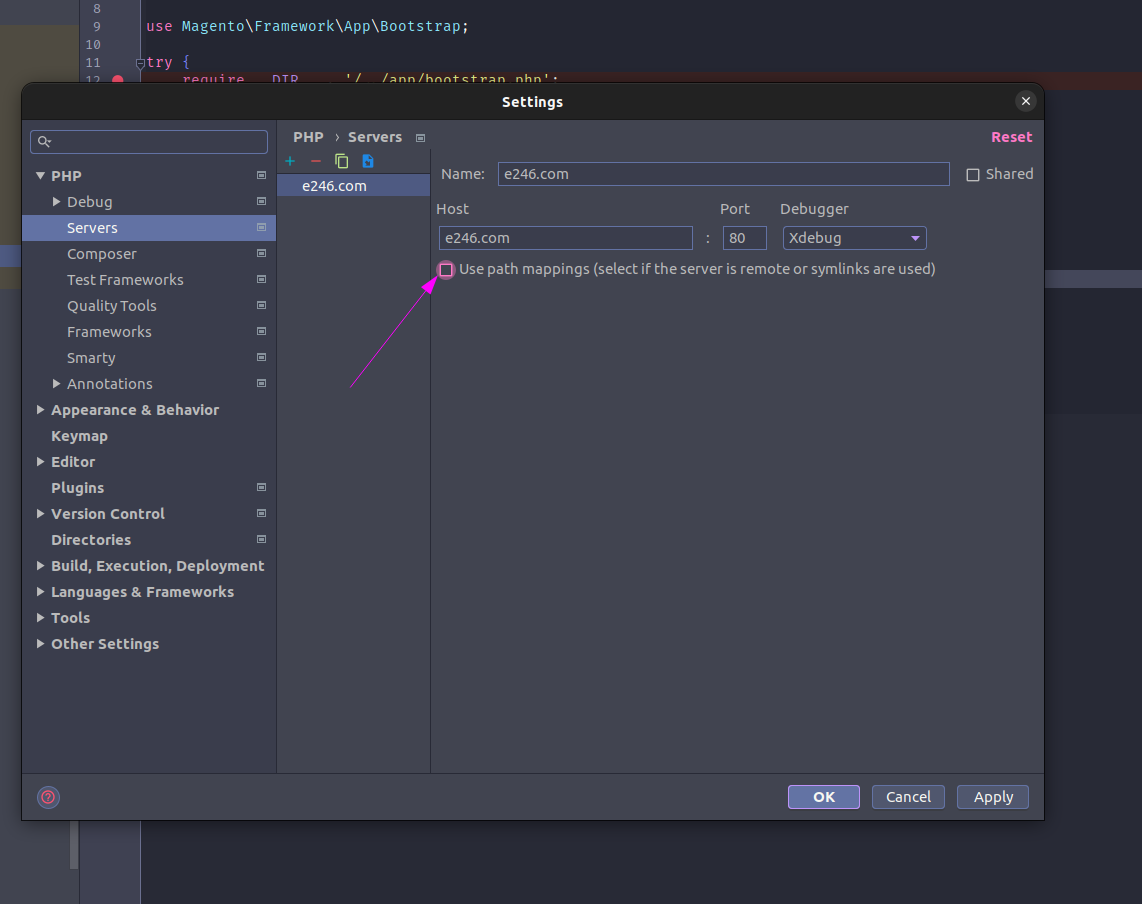
Go to Setting of
PHP > servers, uncheck the option specified in the text
-
Click
Ok -
Lastly, refresh your Site in the browser
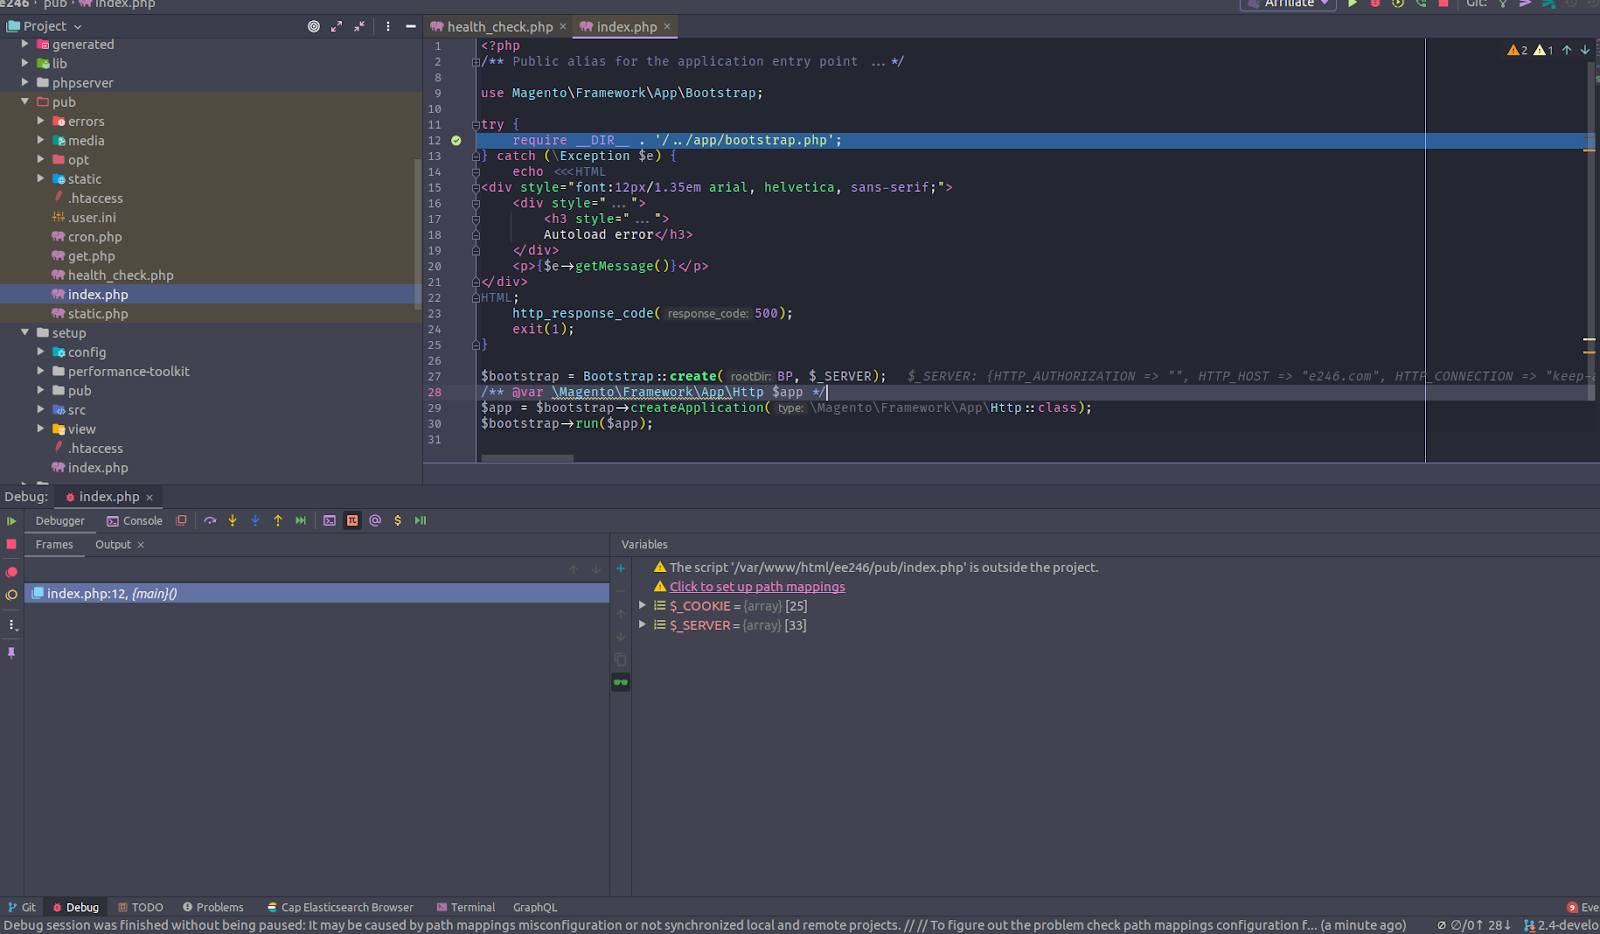
That is all the steps! Now you can try using keyboard shortcuts like F9, F8, F7,.. or check the variable in PhpStorm
Final Word
We hope that our blog has given you a clear understanding of how to set up Xdebug in PhpStorm. Just follow the step-by-step guide above, and you will succeed. If you encounter any challenges or have any questions, don’t hesitate to contact us.


